本节内容:
highcharts 饼图背景色透明的实现方法。
>>> 如果您不了解Highcharts为何物,请参考 Highcharts教程 中的相关内容。
默认的highcharts 背景都是白色,这次项目中需要在highcharts图的后面显示背景图片,所以必须让chart背景透明:
复制代码 代码示例:
function showPie(name){
var a = [
{name:'A',y:100,href:'http://www.jb200.com',color:'#D587CE'},
{name:'B',y:30,href:'http://www.jb200.com',color:'#34E3FF'},
{name:'C',y:10,href:'http://www.jb200.com',color:'#8EF58B'},
{name:'D',y:10,href:'http://www.jb200.com',color:'#F1FE19'},
{name:'E',y:5,href:'http://www.jb200.com',color:'#F8E104'},
{name:'F',y:5,href:'http://www.jb200.com',color:'#F68101'}
]
var chartOption = {
chart: {
renderTo: name,
backgroundColor: 'rgba(255, 255, 255, 0)',
plotBorderColor : null,
plotBackgroundColor: null,
plotBackgroundImage:null,
plotBorderWidth: null,
plotShadow: false,
borderWidth : 0,
events: {
load: function() {
this.renderer.image('cg.png', 41, 38, 40, 43)
.attr({
zIndex: 7
})
.add();
}
}
},
credits :{
enabled:false
},
title: {
text: ''
},
tooltip: {
formatter: function() {
//alert(1);
//return '<b>'+ this.point.name +'</b>: '+ this.percentage +' %';
return '<b>'+ this.point.name +'</b>: '+ this.y;
},
style: {
color: '#333333',
fontSize: '10pt',
padding: 5,
zIndex:9999
}
},
plotOptions: {
pie: {
allowPointSelect: true,
borderWidth : 0,
cursor: 'pointer',
dataLabels: {
enabled: false
},
showInLegend: false,
point: {
events : {
click: function(event){
alert(this.y);
window.open(this.href);
}
}
},
dataLabels: {
enabled: false,
color: '#000000',
//distance: -20,
connectorColor: '#000000',
formatter: function() {
return '<b>'+ this.point.name +'</b>: '+ this.percentage +' %';
}
},
showInLegend: false,
size:68
}
},
series: [{
type: 'pie',
name: 'Browser share',
data: a
}]
}
new Highcharts.Chart(chartOption);
}
代码说明,关键语句为:
复制代码 代码示例:
backgroundColor: 'rgba(255, 255, 255, 0)',
plotBorderColor : null,
plotBackgroundColor: null,
plotBackgroundImage:null,
plotBorderWidth: null,
plotShadow: false,
其中:
复制代码 代码示例:
events: {
load: function() {
this.renderer.image('cg.png', 41, 38, 40, 43)
.attr({
zIndex: 7
})
.add();
}
}
为初始化时在饼图中心加载1个图像,4个参数分别为,左右 上下 宽 和 高度,具体可以自行试验。
结果图,如下所示:
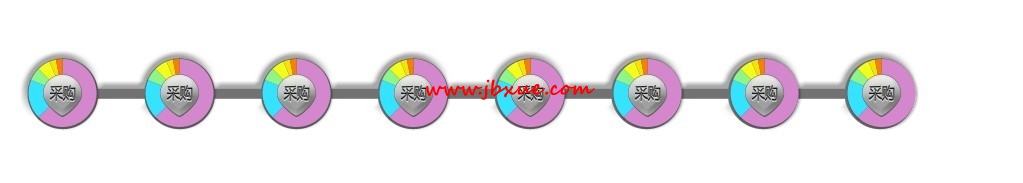
横杠处为背景图片,可以想象若chart背景不为透明,则会遮盖住背景图片。
就是这样了,在HighCharts 饼图中实现了背景色透明,希望对大家有所帮助。