本节内容:
highcharts 直线图的绘制实例。
1,Highcharts简介
Highcharts 是一个用纯javascript编写的一个图表库, 能够很简单便捷的在web网站或是web应用程序添加有交互性的图表,并且免费提供给个人学习、个人网站和非商业用途使用。目前HighCharts支持的图表类型有曲线图、区域图、柱状图、饼状图、散状点图和综合图表。
HighCharts界面美观,由于使用JavaScript编写,所以不需要像Flash和Java那样需要插件才可以运行,而且运行速度快。
另外HighCharts还有很好的兼容性,能够完美支持当前大多数浏览器。
>>> 如果您尚不知HighCharts为何物,请参阅 本站分享的 Highcharts教程 中的经典内容吧。
2,Highcharts绘制直线图
1)、直线图的效果
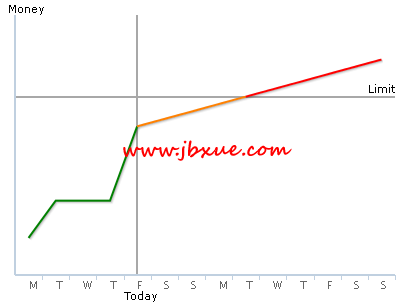
2)、绘制直线的js文件--chart_line.js:
复制代码 代码示例:
var chart;
$(function() {
chart = new Highcharts.Chart({
chart: {
renderTo: 'chart_line',//图表放置的容器--Div
defaultSeriesType: 'line',//图表类型line(折线图)
},
title: {
text: null //图表标题,这里设置为空,可以根据自己的需求设置内容
},
credits:{enabled:false},
legend:{enabled:false},
xAxis: {//x轴
categories: ['M', 'T', 'W', 'T', 'F', 'S', 'S', 'M', 'T', 'W', 'T', 'F','S','S'],//x轴标签名称
gridLineWidth: 0,//设置网格宽度为1
lineWidth: 2,//基线宽度
labels:{align:'left'},
plotBands: [{//数据块显示,可以根据from,to属性绘制数据块
color: '#A8A8A8',
width: 2,
value: 4,
label: { // www.jb200.com
text: 'Today',
style: {color: 'black',font:'normal 11px Verdana, sans-serif' },
align: 'center',
textAlign:'center',
rotation: 360,
verticalAlign:'bottom',
y:25
}
}]
},
yAxis: {
title: {text: 'Money',align: 'high',offset:-45,rotation: 0,y:-2,x:-15,style: {color: 'black',font:'normal 11px Verdana, sans-serif' }},
lineWidth: 2,
gridLineWidth: 0,
tickPixelInterval:40,
labels: {
formatter: function() {//去掉Y轴的刻度显示
return '';
}
},
plotBands: [{
color: '#A8A8A8',//设置数据块的颜色
width: 2,
value: 24,
label: {
text: 'Limit',
style: {color: 'black',font:'normal 11px Verdana, sans-serif' },//设置数据块对应字体颜色
align: 'right',
textAlign:'right',
verticalAlign:'bottom',
x: 0
}
}]
},
plotOptions:{//设置数据点
line:{
dataLabels:{
enabled:false //在数据点上不显示对应的数据值
},
enableMouseTracking: true //取消鼠标滑向触发提示框
}
},
series: [{//数据列
name: 'Lower',
data: [{y:5,marker:{enabled: false}},{y: 10,marker:{enabled: false}},{y: 10,marker:{enabled: false}},{y: 10,marker:{enabled: false}},{y: 20,marker:{enabled: false}},null,null,null,null,null,null,null,null,null],
color:'green'
},{
name: 'Middle',
data: [null,null,null,null,{y: 20,marker:{enabled: false}}, {y: 21,marker:{enabled: false}}, {y: 22,marker:{enabled: false}},{y: 23,marker:{enabled: false}},{y: 24,marker:{enabled: false}},null,null,null,null,null],
color:'#FF8000'
},{
name: 'High',
data: [null,null,null,null,null, null, null, null,{y: 24,marker:{enabled: false}},{y: 25,marker:{enabled: false}},{y: 26,marker:{enabled: false}},{y: 27,marker:{enabled: false}},{y: 28,marker:{enabled: false}},{y: 29,marker:{enabled: false}}],
color:'#FF0000'
}
]
}); //通过marker控制线上的点是否显示
});
3)、HTML对应的内容:
复制代码 代码示例:
<!DOCTYPE html PUBLIC "-//W3C//DTD XHTML 1.0 Transitional//EN" "http://www.w3.org/TR/xhtml1/DTD/xhtml1-transitional.dtd">
<html xmlns="http://www.w3.org/1999/xhtml">
<head>
<meta http-equiv="Content-Type" content="text/html; charset=utf-8" />
<title>HighCharts绘制直线图-www.jb200.com</title>
<link type="text/css" href="css/redmond/
jquery-ui-1.8.23.custom.css" rel="stylesheet" />
<script type="text/javascript" src="js/jquery-1.8.0.min.js"></script>
<script type="text/javascript" src="js/jquery-ui-1.8.23.custom.min.js"></script>
<script src="js/highcharts.src.js"></script>
<script src="js/chart_line.js">
</script>
</head>
<body>
<div id="chart_line" style="width:400px; height: 300px" align="left">
</div>
</body>
</html>